About saturation modeling
The fluid models you create in JewelSuite Subsurface Modeling provide a high level description of the fluid distribution. The fluid distribution is defined by fluid compartments which have different fluid levels. The fluid saturation distribution in the reservoir, especially in the transition zone, is not uniform and is often complex. The saturation model captures the fluid saturation distribution versus capillary pressure and can highly influence the results in volumetric calculation and dynamic simulation.
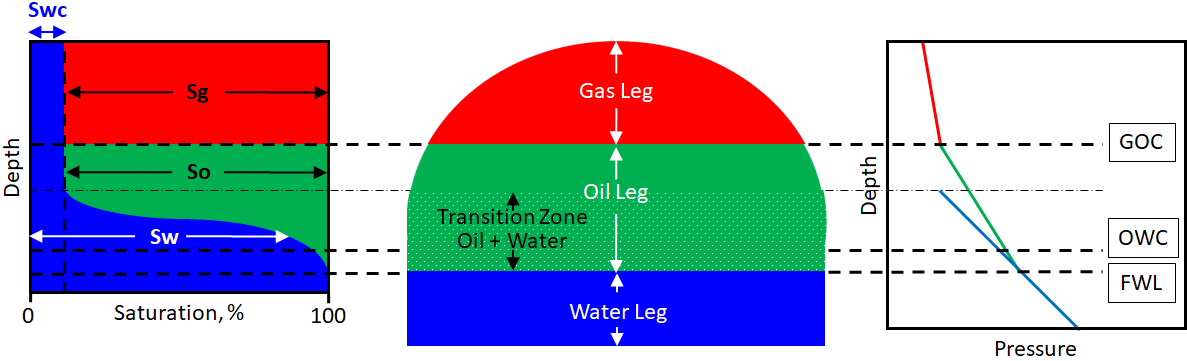
An example for an idealized initial saturation distribution, and pressure profile of a reservoir (gas-oil-water system). In the oil-water transition zone, the water saturation (Sw) is gradually changing from 100% to connate water saturation (Swc). click to enlarge
Capillary pressure
When determining the saturation distribution in a reservoir, hydrostatic equilibrium is assumed. This means that above the Free Water Level (FWL), the water saturation is governed by the equilibrium between buoyancy forces and gravity. The capillary rise of water above the FWL is a function of fluid densities and the radius of the capillary tube, as shown below.
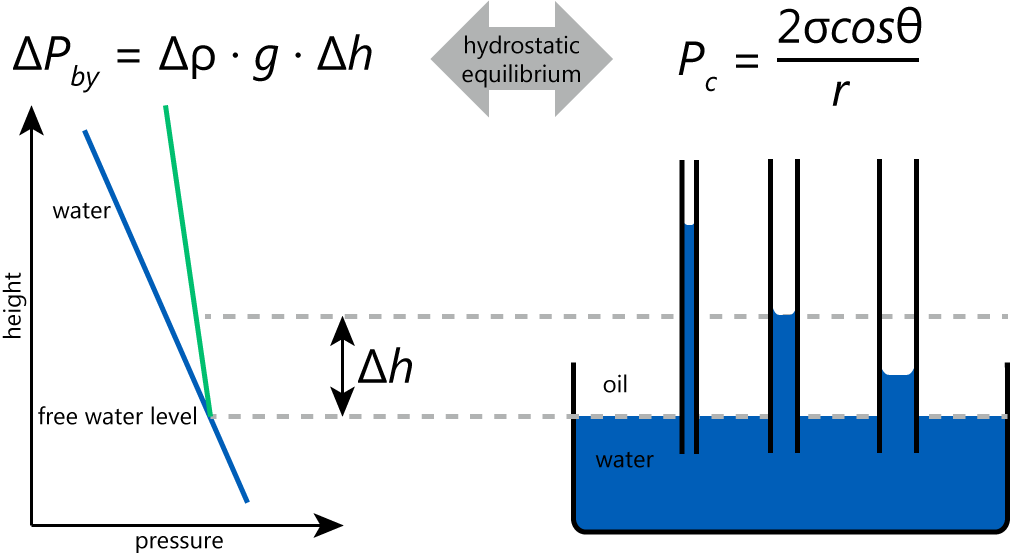
The capillary effect determines the variation of saturation with distance above FWL. click to enlarge
Pore throat distribution, porosity and permeability
A porous rock can be considered as a set of interconnected capillaries with different radii. The range of radii of the capillary tubes in porous rock is called the pore throat distribution. Just above the FWL, (almost) all pores in the rock will be filled with water. At greater vertical distances above the FWL, the capillary rise means water will only be retained in the smaller pores. The fraction of pore space that is filled with water, i.e. the water saturation, decreases with distance from the FWL, and this is what you see in saturation logs.
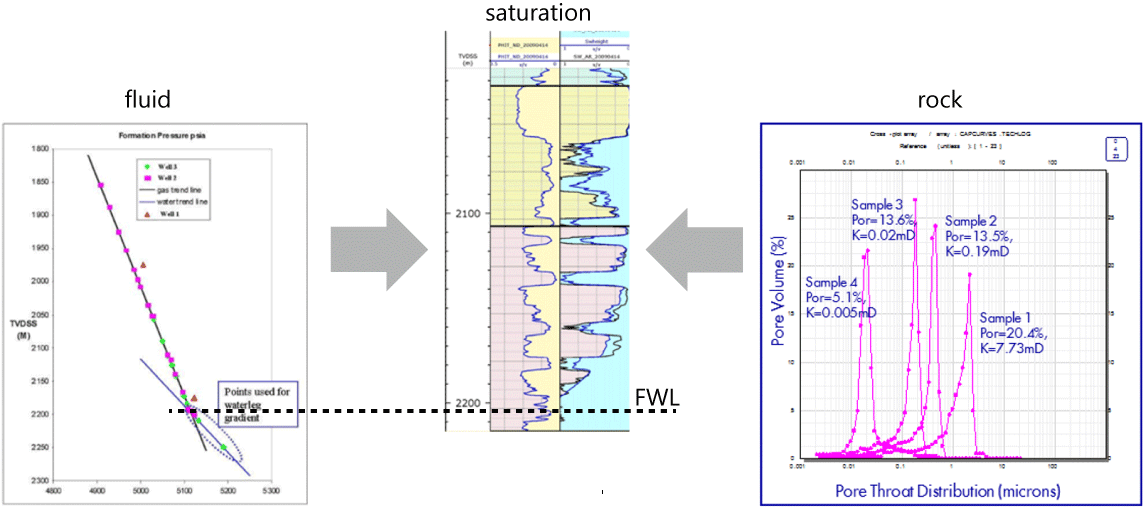
Saturation as a rock-fluid property. The combined log in the center shows porosity on the left and oil saturation on the right. The oil saturation is clearly dependent on distance to FWL. The logs also show that the saturation correlates with porosity, but to be more specific the saturation correlates with the pore throat distribution (shown right). click to enlarge
Although saturation is linked to pore throat distribution, this cannot be measured directly via logs, so porosity and permeability are typically used as a proxy. The relationship between porosity/permeability and pore throat is non-trivial, and varies for different 'rock types'. This means that creating a saturation function model involves rock type classification, establishing functions for each rock type, and regressing on coefficients to match the saturation logs.
The Saturation Function Modeling workflow has the ultimate purpose of reproducing the saturations as seen in the actual saturation logs as a function of:
- FWL
- fluid densities, interfacial tension and contact angle (capillary pressure)
- porosity and permeability
HAFWL versus rock Pc
Historically, it was common practice to express saturations as a function of Height Above Free Water Level (HAFWL). In recent years, however, it has been generally accepted that saturation functions are best represented using the rock Pc , Pcr (or Pc,IFT1) which is defined as:

where σ is the interfacial tension and θ is the wetting angle. The main advantage of the rock Pc is that it is a rock property and all fluid dependency has been normalized out. This approach is supported by the most commonly used petrophysics software packages, and generally recommended.
Function types
For saturation function modeling, JewelSuite supports the main industry-standard saturation function types: Brooks-Corey, Lambda, Leverett J, Thomeer and Skelt-Harrison.
Taking the Brooks-Corey formulation as an example, the relationship between the water saturation Sw and capillary pressure Pc is expressed as:

where Pcr is the capillary pressure normalized to an interfacial tension of 1 dyne/cm (also known as Rock Pc), and Pcr,t is the threshold capillary pressure.
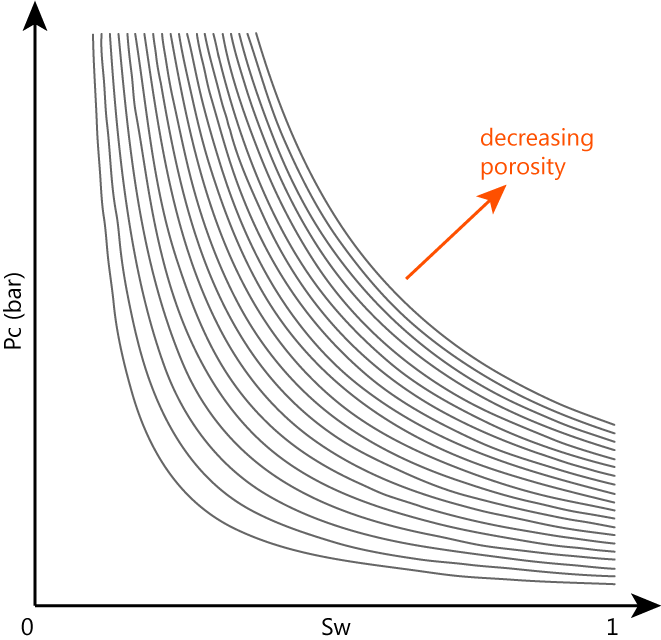
Brooks-Corey saturation function for a range of porosity values in a single rock type. click to enlarge
The three parameters in red are coefficients of the equation. It is important to note these are in turn a function of porosity and permeability. So the equation can be shown as a series of Pc versus Sw curves for various values of porosity.
Despite the flexibility that this offers, it is sometimes not possible to describe all observed saturations with a single saturation function. In this case, it is necessary to distinguish multiple rock types and to derive a saturation function for each rock type (facies).
Modeling saturation in paleo zones
In specific situations if the reservoir consists of residual hydrocarbons below the present day FWL you must model them with a Paleo FWL on the Fluid Levels form during the Fluid Modeling workflow. The saturation in the paleo zone in such situations must be modeled with the fluid model that consists of Paleo FWL. JewelSuite Subsurface Modeling uses the Brooks Corey + Land correlation, or the Brooks Corey + Skjaeveland correlation to model the saturation above the Paleo FWL.
Using this correlation, you can model the residual hydrocarbon saturation below the present day FWL and above the Paleo FWL. The saturation height function is applied above the Paleo FWL and the residual hydrocarbon below the present day FWL is modeled using the Land correlation. The hydrocarbon saturation above the present day FWL is modeled using the standard Brooks Corey equation discussed above and remains unchanged.
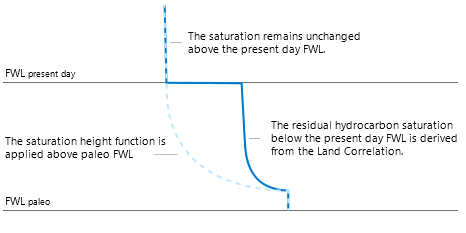
Schematic plot describing the saturation height function for Brooks Corey + Land correlation. click to enlarge
The Land correlation used to calculate residual hydrocarbon saturation in the paleo zone is defined as:

where Shc,r* is residual fraction and is calculated as:

where C is the Land constant, and Shc,i* is the initial hydrocarbon saturation in paleo times. The Land constant can be treated as an uncertain variable in volumetric studies, and it is inversely proportional to the calculated residual fraction. Note that this correlation is applicable for water wet systems only.
The Brooks Corey and Skjaeveland correlation offers a more physically robust method than the Land correlation and it is also applicable for mixed wet systems. The Skjaeveland imbibition correlation allows you to model additional hydrocarbon saturation in paleo zones below the present day FWL.
Refer to the schematic below showing the primary drainage curves for water and hydrocarbons above paleo FWL and the resulting imbibition curve that is used to derive the water and hydrocarbon saturations above and below present day FWL.
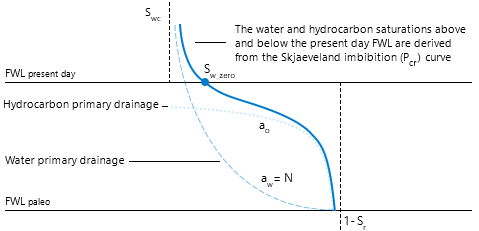
Schematic plot describing the saturation height function for Brooks Corey + Skjaeveland correlation. click to enlarge
In the schematic, Sw_zero is the water saturation of the imbibition curve when Pc equals zero and it is defined as:

where,
Wr is the wetting ratio which is an indicator of system wettability. For example, Wr = 0 indicates a fully wet system. Wettability ratio is defined as:

ao is the shape factor of the hydrocarbon primary drainage and it is calculated using the aw/ao ratio as defined by the user, intentionally making ao independent of the rock quality.
aw is equal to parameter N from the Brooks-Corey drainage saturation function and 1/N is defined as the pore size distribution index.
The resulting general equation to calculate the water saturation using the Skjaeveland correlation is:

where cw is the capillary entry pressure, 1/aw is the pore size distribution index and Swirr is the irreducible water saturation.
For mixed-wet systems, the capillary pressure is calculated using:

where the constants aw, ao and cw are positive numbers while co is a constant and negative. The first term in the equation represents the ‘water’ wet part while the second term the ‘oil’ wet part. Shc is the hydrocarbon saturation and Sr is the residual hydrocarbon saturation. On the Saturation Functions form, you can input the value of these constants as coefficients defined with the wetting ratio and the aw/ao ratio along with the Land constant.
For more information, refer to Skjaeveland, S. M., Siqveland, L. M., Kjosavik, A., Hammervold, W. L., Virnovsky, G. A., Capillary Pressure Correlation for Mixed-Wet Reservoirs, SPE 39497, presented at SPE India Oil and Gas Conference and Exhibition, New Delhi, February 1998.